Are your Kubernetes applications inexplicably slowing down, even when your nodes seem to have plenty of CPU to spare? You might be experiencing CPU throttling. I recently watched an excellent CNCF video by Dave Chiluk, an engineer at Indeed. I encourage you to watch the whole video. There is also a related blog article from Indeed. Although the video is from 2020 and the topic goes back to even 2018, I found his explanation of why he was seeing CPU throttling in certain Linux kernel versions very helpful in understanding how CPU throttling works in general. This article has some of my takeaways from the video.
CPU Throttling in Kubernetes
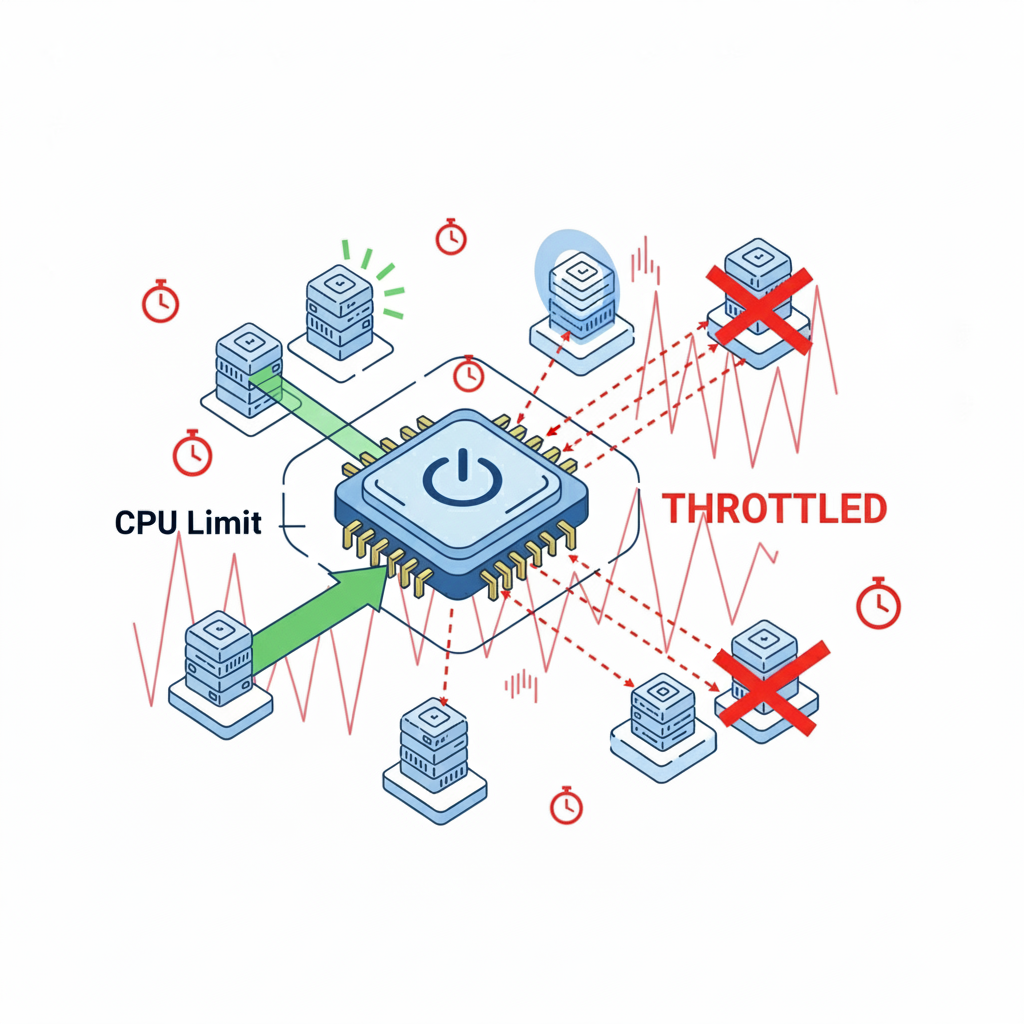
In Kubernetes, you define CPU requests and CPU limits for your pods. While requests ensure your pod gets a proportional share of CPU time, limits set a hard cap on how much CPU your container can consume. It’s this limit, specifically how the Linux kernel’s Completely Fair Scheduler (CFS) bandwidth control enforces it, that can lead to throttling.
What is Throttling? Imagine your application is given a fixed amount of CPU “time” (its quota) to use within a short “window” (the period). If your application exhausts this quota before the period ends, it’s forced to wait until the next period begins. This waiting is throttling. Even if the node has idle CPU, your application is artificially constrained.
The default period for CFS is 100 milliseconds. If your pod has a CPU limit, say 400 millicores (0.4 CPU), its quota per period is calculated as:
(CPU Limit / 1000) * Period = Quota (400 mc / 1000) * 100 ms = 40 milliseconds
This means your application can only use 40ms of CPU every 100ms. If it needs more, it’s throttled.
Identifying the Problem
You can directly monitor throttling using two key metrics. These are exposed by the kubelet running on each node. They metrics are typically collected by a monitoring system like Prometheus.
container_cpu_cfs_throttled_periods_total: This counter increments every time your container is throttled.container_cpu_cfs_periods_total: This counter indicates the total number of quota periods.
From these, you can calculate your throttle percentage:
(Throttled Periods / Total Periods) * 100 = Throttle Percentage
A high throttle percentage (e.g., above 1-5%) is a strong indicator of a problem.
A Fix Regression for a Linux Kernel Issue
Indeed’s deep dive into this issue revealed an interesting regression introduced after a fix attempt (kernel commit 512ac999) for a CPU clock-skew throttling problem within the Linux CFS-Cgroup bandwidth control.
The core of the issue was that the kernel’s scheduler, which gives each CPU a small time slice (5ms) from a global quota bucket, was configured to expire any unused local time at the end of a scheduling period. While this expiration was negligible on machines with few CPU cores, it became a significant problem on high-core-count machines. For example, on an 88-core machine, this could lead to 87ms of unusable CPU time per period, resulting in excessive throttling and reduced application performance.
Going back to the previous example container with 40ms of quota for a 100ms period. If it only uses 10ms of that quota in the first 10ms of the period, the remaining 30ms might not be carried over. This “stranded” quota led to applications being throttled even when they hadn’t used their full allocation across the entire period, particularly when bursty applications needed more CPU upfront.
The solution was to eliminate the expiration logic, which allows unused time slices to accumulate. This change ensures that the kernel strictly enforces average CPU usage over a longer time window while also limiting burst capacity. This fix has since been merged into mainline kernels (5.4 and later), leading to more efficient CPU utilization and improved application performance on high-core-count systems.
Actionable Items to Combat CPU Throttling
- Upgrade Your Kernel (The Most Effective Fix): The kernel fix that alleviates this specific throttling behavior is available in Linux kernel versions 5.4 and newer. If you’re running on older kernels, upgrading is highly recommended. This often provides the most significant and lasting solution.
- Monitor Throttling Metrics Regularly: Integrate
container_cpu_cfs_throttled_periods_totalandcontainer_cpu_cfs_periods_totalinto your monitoring dashboards. Set up alerts for high throttle percentages to proactively identify and address issues. - Adjust CPU Limits (If Kernel Upgrade Isn’t Possible): If a kernel upgrade isn’t immediately feasible, consider these workarounds:
- Increase CPU Limits: If an application genuinely needs more CPU, raise its limit. This gives it a larger quota per period.
- Use Whole CPU Quotas (e.g., 1.0, 2.0 CPU): While not always practical, aligning limits with whole CPU units can sometimes mitigate the issue, particularly if your application can be designed around this.
- Remove CPU Limits Entirely (Use with Caution!): For non-critical applications or in environments where resource contention is low, removing CPU limits can eliminate throttling. However, this carries the risk of a runaway process consuming all node CPU, impacting other applications. Use this only after careful consideration and testing.
- Understand Your Application’s CPU Profile: Is your application bursty, or does it require sustained CPU? Tools like profilers can help you understand your application’s CPU usage patterns, which can inform your resource limit decisions.
Conclusion
CPU throttling in Kubernetes is a stealthy performance killer I see all the time on workloads in the clusters I manage. Our team regularly reaches out to developers to help them tune their CPU resources requests and limits to avoid throttling.
Prioritize kernel upgrades, and if that’s not possible, carefully adjust your CPU limits while continuously monitoring your application’s performance.
By the way, the video also suggests setting the CPU governor on the linux host to performance mode. The rationale is that other governors, like the modern schedutil or older ondemand, dynamically scale the CPU frequency up and down to save power. When a workload spike hits, the governor needs time (albeit a very short amount) to ramp the CPU back up to its highest frequency. Performance mode eliminates this delay entirely by keeping the CPU at its maximum frequency at all times. While this might not make sense for personal computers and laptops, in cloud VMs where you pay a fixed cost for instance vCPUs, this might something to try.
